Linear Regression
Linear Regression
Linear Regression using Python
Objective
This project aims at predicting an outcome (e.g., house prices) based on a single feature (e.g., house area). It can be achieved through:
- Exploring a real-world dataset
- Preparing and splitting data for training and testing
- Building a simple linear regression model using Scikit-learn’s LinearRegression
- Evaluating the model using key metrics i.e., MAE, MSE, RMSE, and R² Score
- Visualizing predictions and regression lines
- Publishing the project on GitHub/Portfolio
Project Execution
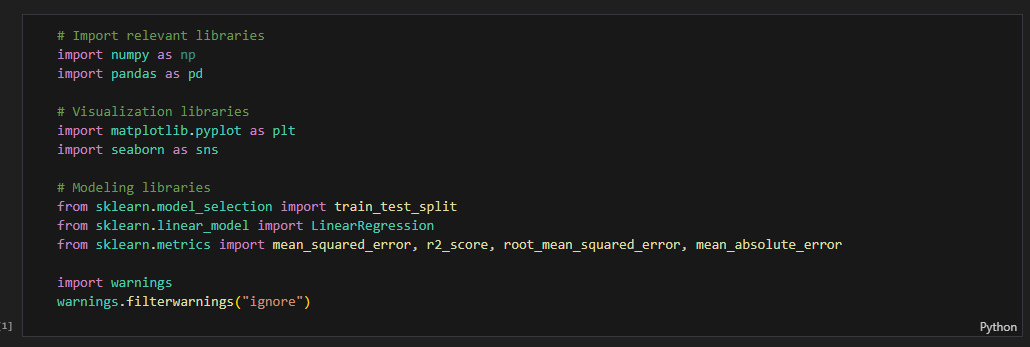
Import relevant libraries
Loading the datasets
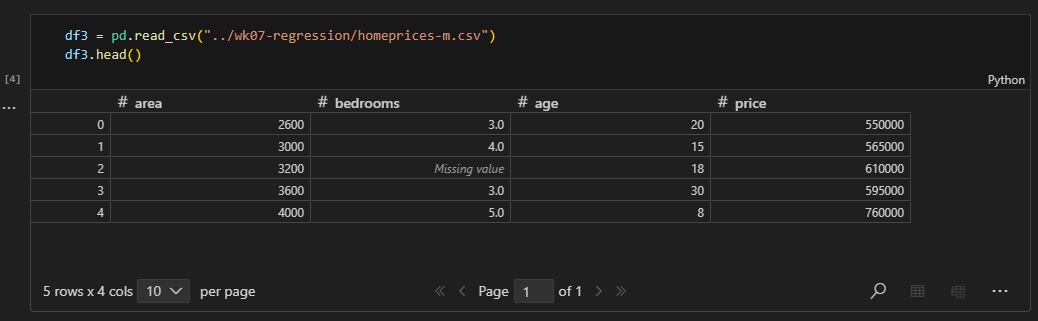
- The dataset consisted of area, bedrooms, age, and price
Exploratory Data Analysis
- Checking the shape
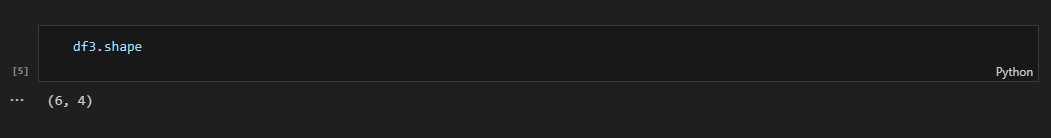
- The dataset consists of 6 rows (inclusive of header) and 4 columns
- Check for irregularities
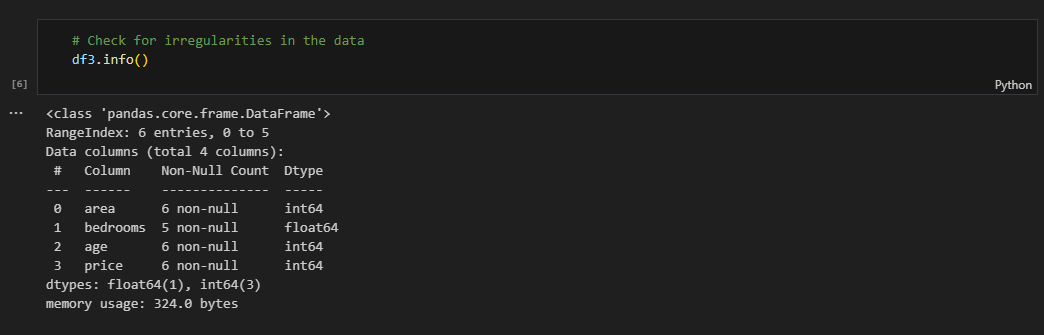
- Presence of missing values in
bedroomscolumn bedroomsshould be of integer data type
- Presence of missing values in
- Summary statistics
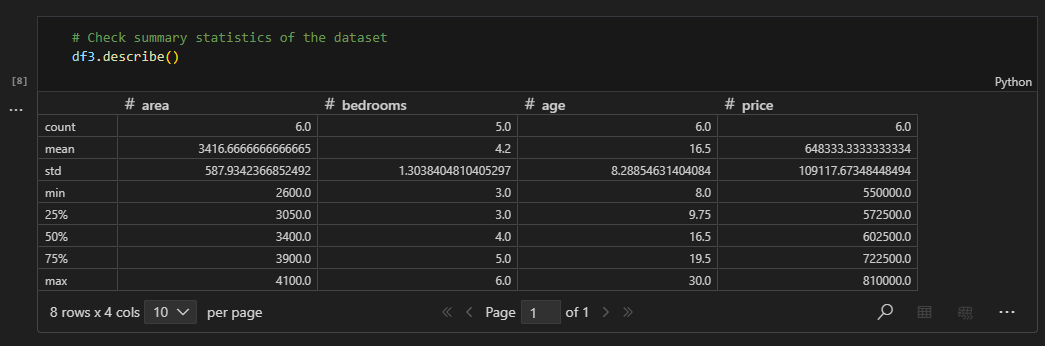
Impute Missing Values
- Impute
bedrooms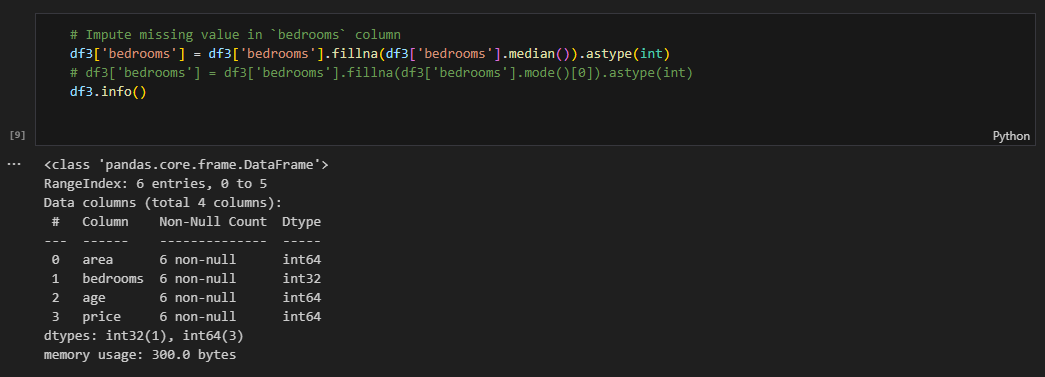
- The missing value was filled by
mediani.e., the middle value of thebedrooms, since the value was missing at random (MAR)
- The missing value was filled by
Visualize Data
The visualizations show the relationship between area, bedrooms, and age versus price
Scatter Plot of
areavsprice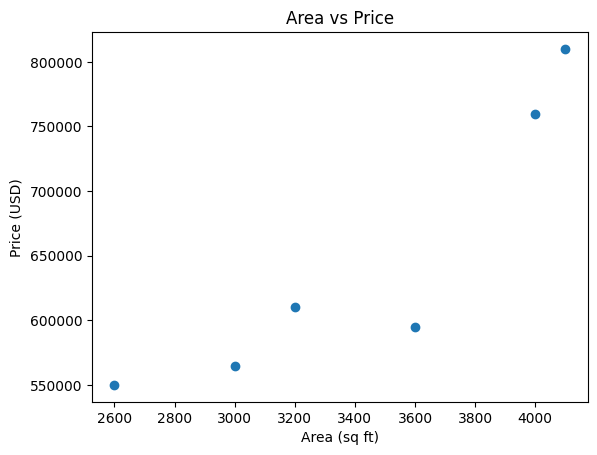
Scatter Plot of
bedroomsvsprice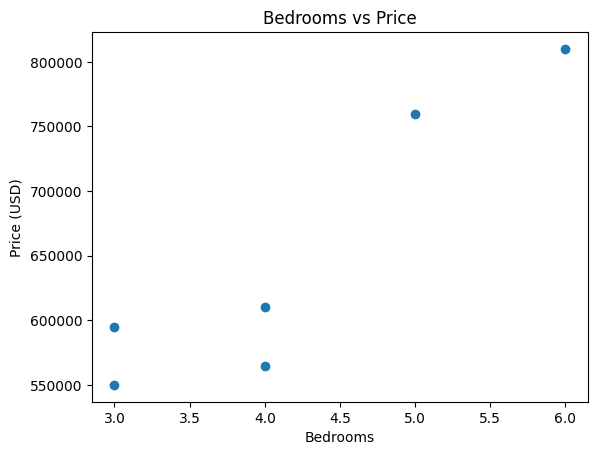
Scatter Plot of
agevsprice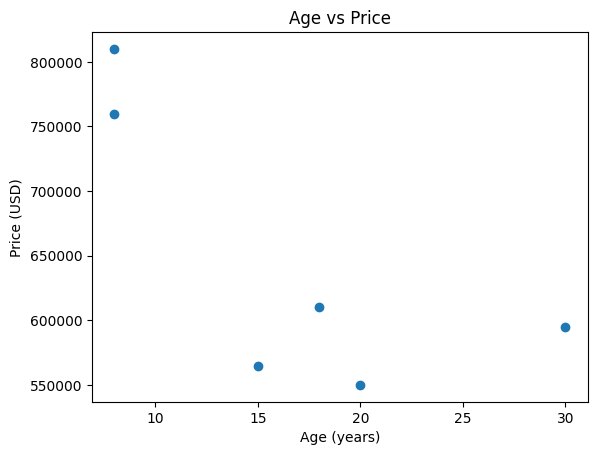
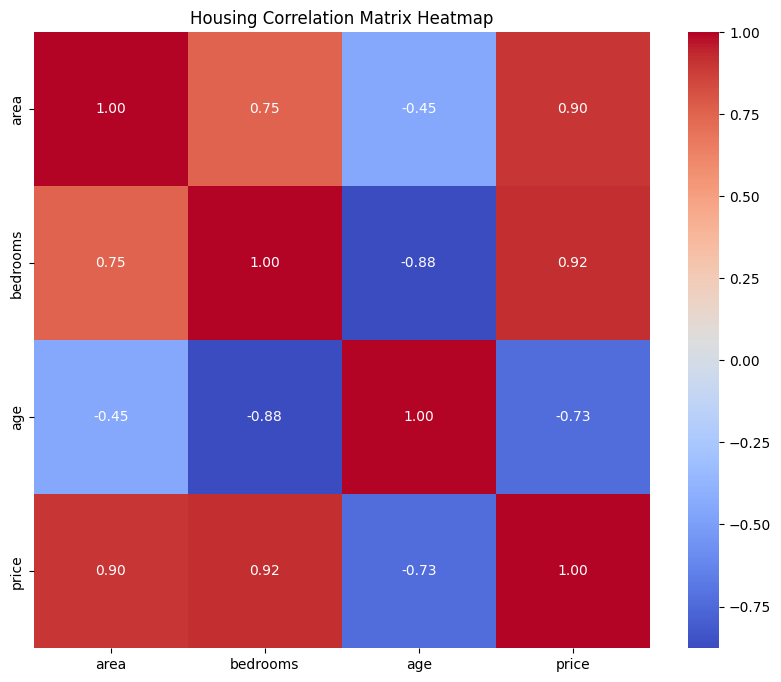
Correlation Heatmap This shows the relationship between features
- There
ageof the house has anegative relationshipwith theprice. As theageof the house increases, thepricedecreases. - The
areaand thenumber of bedroomsshow a positive relationship with theprice. As theareaand thenumber of bedroomsincreases, thepriceof the house also increases.
- There
Feature Engineering
- Define the
targetandfeaturevariables - Split the dataset into
trainandtest
- Define
targetandfeaturevariables and split the data intotrainandtest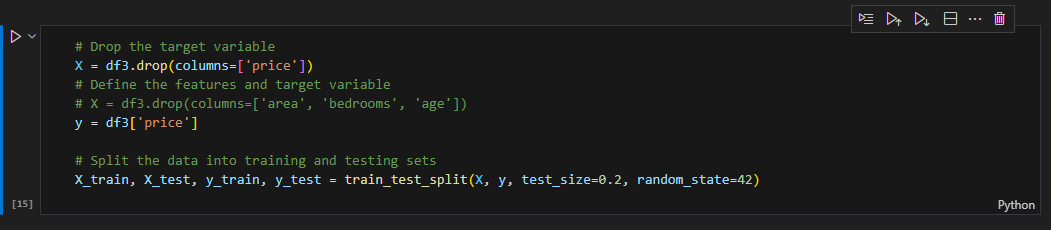
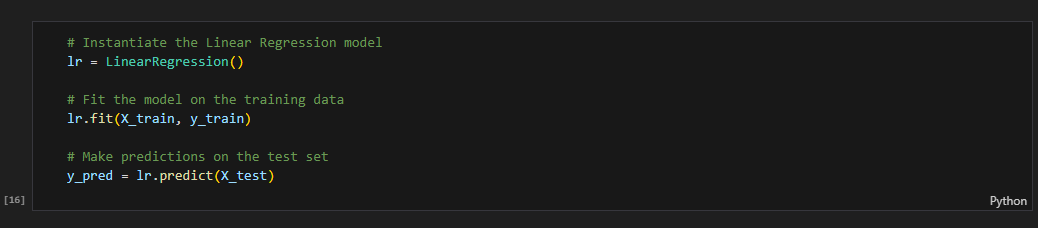
Model Building
Train model
Print
Coefficients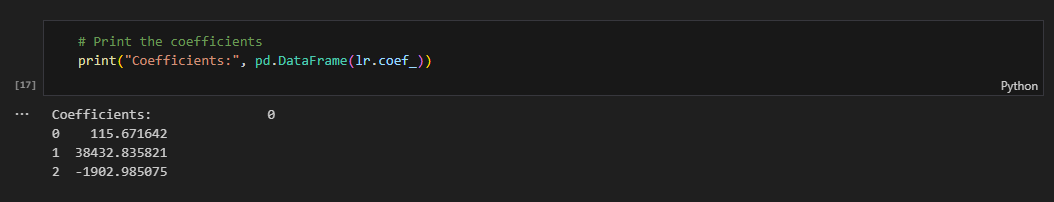
Print the
intercept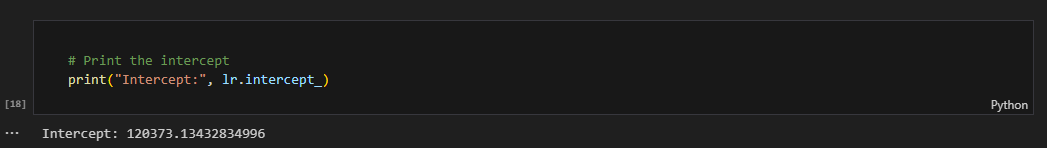
Evaluate the Model
Evaluate the model using
mse,r2,rmse, andmae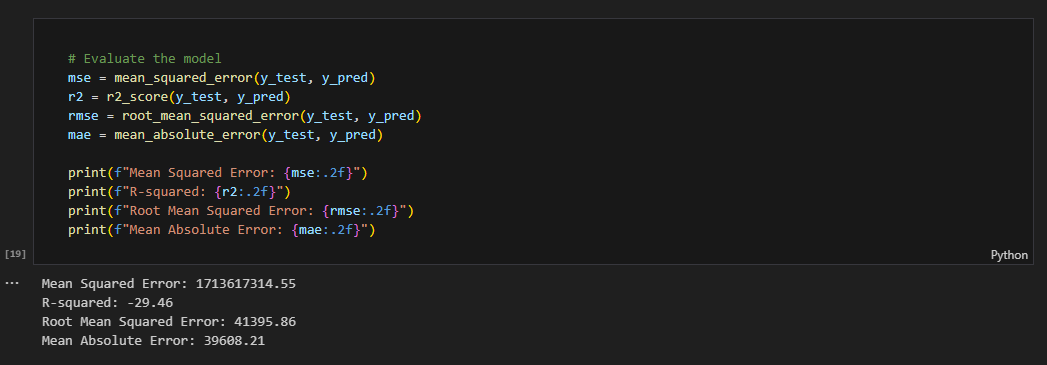
PredictedvsActual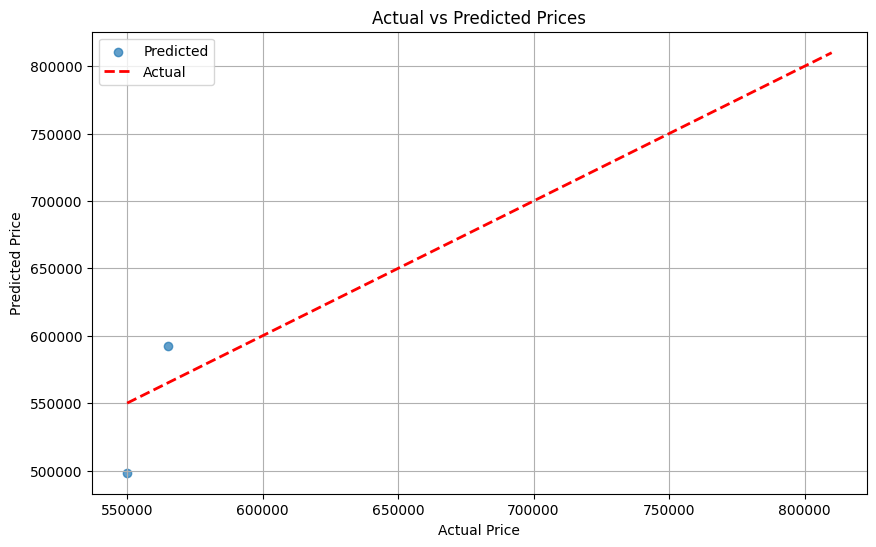
Conclusion
- The model performed fairly due to the distance between the actual and predicted values. The model can be improved in future by performing hyperparameter tuning.
- The model is performing poorly due to poor fit between the model and the data which oversimplifies the model causing biasness, thus underfitting. This can be improved by increasing the data.
This post is licensed under CC BY 4.0 by the author.