Titanic Exploratory Data Analysis
History of the Titanic
The RMS Titanic was a British cruise ship that sank on April 15, 1912, during its maiden voyage from Southampton, England, to New York City. It was the largest ship in the world at the time, measuring 882 feet long and 92 feet wide, and displacing
52,310 long tons. The Titanic departed from Southampton on April 10, 1912, stopping at the French port of Cherbourg and the Irish port of Queenstown to pick up more passengers before setting off across the Atlantic Ocean. Despite receiving
several ice warnings, the Titanic continued at full speed, and at 11 p.m. on April 14, 1912, lookout Fred Fleet spotted an iceberg dead ahead. First Officer William Murdoch ordered the ship turned hard to port and signaled the engine room
to reverse direction, but the ship was too large, moving too fast, and the iceberg was too close. The Titanic struck the iceberg, causing several compartments to begin filling with water. The ship’s design included a double-hull and 16
watertight compartments sealed by massive doors that could be instantly triggered by a single electric switch on the bridge or automatically by electric water-sensors. However, the ship was not designed to withstand a collision that would
flood more than four compartments, and the iceberg had caused five compartments to begin filling with water. The ship began to sink, and the crew began to get people aboard the lifeboats. There were not enough lifeboats for all the passengers,
and many left the Titanic only half full. The Titanic sank at 2 a.m. on April 15, 1912, with approximately 1,500 people still on board. The disaster led to the establishment of the International Ice Patrol and the first International Convention
for Safety of Life at Sea, which required every ship to have lifeboat space for each person embarked, hold lifeboat drills, and maintain a 24-hour radio watch.
Objective
To conduct an Exploratory Data Analysis on the Titanic dataset. This includes Univariate, Bivariate, Multivariate, Outlier, and Target Analysis of the data. The dataset was obtained from this link
Data Dictionary
| Feature Name |
Description |
Category (Optional) |
| PassengerId |
Unique identifier of the passenger |
|
| Survived |
Survival |
0 = No, 1 = Yes |
| Pclass |
Ticket class |
1 = Upper, 2 = Middle, 3 = Lower |
| Name |
Name of the passenger |
|
| Sex |
Gender of the passenger |
male, female |
| Age |
Age in years |
|
| SibSp |
Number of siblings / spouses aboard the Titanic |
|
| Parch |
Number of parents / children aboard the Titanic |
|
| Ticket |
Ticket number |
|
| Fare |
Passenger fare |
|
| Cabin |
Cabin number |
|
| Embarked |
Port of Embarkation |
Southampton (S), Cherbourg (C), Queenstown (Q) |
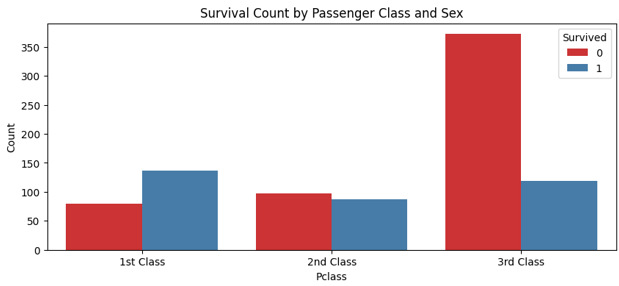
The image below shows the relationship between Passenger Class, Sex, and Survival. Majority of passengers who survived the accident were in 1st class compared to 2nd and 3rd classes. 3rd class experiences the highest death
rates.
Outlier Handling
Outliers cannot be removed because:
It can lead to loss of valuable information, distorting the dataset and/or tampering with the integrity of the data
It can be used to detect rare events such as elderly surviving the titanic accident as seen in the dataset
It can be used to improve predictions during modeling in future and support insights
It can introduce biasness in the dataset especially if the outlier is meaningful and not an error, or processing
Conclusion
61.62% of the population succumbed to the accident compared to 38.38% who survived. Majority of passengers who boarded the titanic were between the age of 20 and 40 accounting for the young adults in the population. Majority of passengers
in the 3rd class died compared to 1st and 2nd class. Majority of men succumbed to the accident compared to women. Majority of the passengers who succumbed to the accident were destined for Southampton port. However, there was an exception
case of an elderly who survived accident that need to be looked into
For further Titanic EDA insights, Click Here
Dunes Sales Exploratory Data Analysis
EDA consists of Data Cleaning (Feature Engineering, identifying and dealing with missing data) Univariate, Bivariate, and Multivariate Analysis, and obtaining insights.
The dataset consists of the following parameters:
Date
Customer
Sales Person
Customer_Age
Customer_Gender
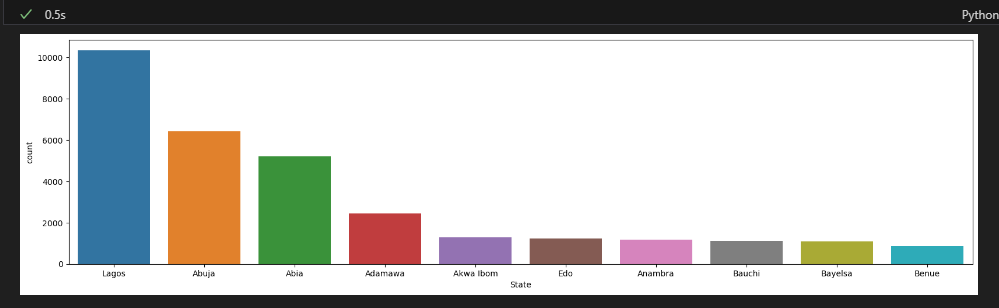
State
Product_Category
Sub_Category
Payment Option
Quantity
Unit_Cost
Unit_Price
For further Dunes EDA insights, Click Here.